EXA2PRO - EoCoE joint workshop, StarPU Tutorial, February, 24th 2021
![]()
This tutorial is part of the EXA2PRO - EoCoE joint workshop taking place online on February, 24th 2021
The general presentation slides are available as PDF.
The tutorial slides are available as PDF.
The recording is available on youtube.
Docker deployment
The tutorial will be performed within a docker container. See the Getting started guide instructions (section 2) to deploy and run the container.
Session Part 1: Task-based Programming Model
Application Example: Vector Scaling
A vector scaling example is available at the root of
the archive file
Base version
The original non-StarPU version (vector_scal0.c) is available in the material tarball and shows the basic example that we will be using to illustrate how to use StarPU. It simply allocates a vector, and calls a scaling function over it.
void vector_scal_cpu(float *val, unsigned n, float factor)
{
	unsigned i;

	for (i = 0; i < n; i++)
		val[i] *= factor;
}
int main(int argc, char **argv)
{
	float *vector;
	unsigned i;

	vector = malloc(sizeof(vector[0]) * NX);
	for (i = 0; i < NX; i++)
		vector[i] = 1.0f;

	float factor = 3.14;
	vector_scal_cpu(vector, NX, factor);

	free(vector);
	return 0;
}
StarPU version
The StarPU version of the scaling example is available in the material tarball:
- The main application (vector_scal_task_insert.c)
- The CPU implementation of the codelet (vector_scal_cpu.c)
- The CUDA implementation of the codelet (vector_scal_cuda.cu)
- The OpenCL host implementation of the codelet (vector_scal_opencl.c)
- The OpenCL device implementation of the codelet (vector_scal_opencl_kernel.cl)
Computation Kernels
Examine the source code, starting from vector_scal_cpu.c : this is
the same vector_scal_cpu computation code, which was wrapped into a vector_scal_cpu
function which takes a series of DSM interfaces and a non-DSM parameter
void vector_scal_cpu(void *buffers[], void *cl_arg) {
The code first gets the vector data, and extracts the pointer and size of the vector data:
	struct starpu_vector_interface *vector = buffers[0];
	float *val = (float *)STARPU_VECTOR_GET_PTR(vector);
	unsigned n = STARPU_VECTOR_GET_NX(vector);
It then gets the factor value from the non-DSM parameter:
	float factor;
	starpu_codelet_unpack_args(cl_arg, &factor);
and it eventually performs the vector scaling:
	for (i = 0; i < n; i++)
		val[i] *= factor;
The GPU implementation, in vector_scal_cuda.cu, is basically
the same, with the host part (vector_scal_cuda) which extracts the
actual CUDA pointer from the DSM interface, and passes it to the device part
(vector_mult_cuda) which performs the actual computation.
The OpenCL implementation in vector_scal_opencl.c and
vector_scal_opencl_kernel.cl is more hairy due to the low-level aspect
of the OpenCL standard, but the principle remains the same.
Main Code
Now examine vector_scal_task_insert.c
- The
cl(codelet) structure simply gathers pointers on the functions mentioned above, and notes that the functions takes only one DSM parameter. It also notes that a performance model should be used.static struct starpu_codelet cl = { .cpu_funcs = {vector_scal_cpu}, .cuda_funcs = {vector_scal_cuda}, .opencl_funcs = {vector_scal_opencl}, .nbuffers = 1, .modes = {STARPU_RW}, .model = &perfmodel, }; - The
mainfunction starts with initializing StarPU with the default parameters:starpu_init(NULL); - It then allocates the vector and fills it like the original code:
vector = malloc(sizeof(vector[0]) * NX); for (i = 0; i < NX; i++) vector[i] = 1.0f; - It then registers the data to StarPU, and gets back a DSM handle. From now on, the application is not supposed to access
vectordirectly, since its content may be copied and modified by a task on a GPU, the main-memory copy then being outdated.starpu_data_handle_t vector_handle; starpu_vector_data_register(&vector_handle, 0, (uintptr_t)vector, NX, sizeof(vector[0])); - It then submits a (asynchronous) task to StarPU.
starpu_insert_task(&cl, STARPU_VALUE, &factor, sizeof(factor), STARPU_RW, vector_handle, 0); - It waits for task completion:
starpu_task_wait_for_all(); - It unregisters the vector from StarPU, which brings back the modified version to main memory, so the result can be read.
starpu_data_unregister(vector_handle); - Eventually, it shuts down StarPU:
starpu_shutdown();
Making it and running the StarPU version
Building
Let us look at how this should be built.
A typical Makefile for
applications using StarPU is the following:
STARPU_VERSION=1.3
CPPFLAGS += $(shell pkg-config --cflags starpu-$(STARPU_VERSION))
LDLIBS += $(shell pkg-config --libs starpu-$(STARPU_VERSION))
%.o: %.cu
	nvcc $(CPPFLAGS) $< -c -o $@

vector_scal_task_insert: vector_scal_task_insert.o vector_scal_cpu.o vector_scal_cuda.o vector_scal_opencl.o
Additionally, to avoid having to set LD_LIBRARY_PATH one can add an rpath:
LDLIBS += -Wl,-rpath -Wl,$(shell pkg-config --variable=libdir starpu-$(STARPU_VERSION))
The provided Makefile additionally detects whether CUDA or OpenCL are available in StarPU, and adds the corresponding files and link flags.
Simulation
If your system does not have a CUDA or OpenCL GPU, you can use the simulation version of StarPU by setting some environment variables by running in your shell:
. ./simu.sh
If you ever want to get back to the non-simulated version of StarPU, you can run in your shell:
. ./native.sh
Note that after switching between the simulated and the non-simulated versions of StarPU, you have to rebuild completely:
make clean
make
Running
Run make vector_scal_task_insert, and run the
resulting vector_scal_task_insert executable
It should be working: it simply scales a given vector by a given factor.
make vector_scal_task_insert

./vector_scal_task_insert
Note that if you are using the simulation version of StarPU, the computation
will not be performed, and thus the final value will be equal to the initial
value, but the timing provided by starpu_timing_now() will correspond
to the correct execution time.
You can set the environment variable STARPU_WORKER_STATS to 1 when running your application to see the number of tasks executed by each device. You can see the whole list of environment variables here.
STARPU_WORKER_STATS=1 ./vector_scal_task_insert

# to force the implementation on a GPU device, by default, it will enable CUDA
STARPU_WORKER_STATS=1 STARPU_NCPU=0 ./vector_scal_task_insert

# to force the implementation on a OpenCL device
STARPU_WORKER_STATS=1 STARPU_NCPU=0 STARPU_NCUDA=0 ./vector_scal_task_insert
Data Partitioning
In the previous section, we submitted only one task. We here discuss how to /partition/ data so as to submit multiple tasks which can be executed in parallel by the various CPUs and GPUs.
Let’s examine mult.c.
- The computation kernel,
cpu_multis a trivial matrix multiplication kernel, which operates on 3 given DSM interfaces. These will actually not be whole matrices, but only small parts of matrices. init_problem_datainitializes the whole A, B and C matrices.partition_mult_datadoes the actual registration and partitioning. Matrices are first registered completely, then two partitioning filters are declared. The first one,vert, is used to split B and C vertically. The second one,horiz, is used to split A and C horizontally. We thus end up with a grid of pieces of C to be computed from stripes of A and B.launch_taskssubmits the actual tasks: for each piece of C, take the appropriate piece of A and B to produce the piece of C.- The access mode is interesting: A and B just need to be read from, and C will only be written to. This means that StarPU will make copies of the pieces of A and B along the machines, where they are needed for tasks, and will give to the tasks some uninitialized buffers for the pieces of C, since they will not be read from.
- The
maincode initializes StarPU and data, launches tasks, unpartitions data, and unregisters it. Unpartitioning is an interesting step: until then the pieces of C are residing on the various GPUs where they have been computed. Unpartitioning will collect all the pieces of C into the main memory to form the whole C result matrix.
Run the application, enabling some statistics:
make mult

STARPU_WORKER_STATS=1 ./mult
Figures show how the computation were distributed on the various processing units.
Other example
gemm/xgemm.c is a very similar
matrix-matrix product example, but which makes use of BLAS kernels for
much better performance. The mult_kernel_common functions
shows how we call DGEMM (CPUs) or cublasDgemm (GPUs)
on the DSM interface. Also note the presence of the
starpu_cublas_init() call in the main function so as to more
efficiently connect cublas with StarPU.
Let’s execute it.
make gemm/sgemm
STARPU_WORKER_STATS=1 ./gemm/sgemm
Exercise
Take the vector example again, and add partitioning support to it, using the
matrix-matrix multiplication as an example. Here we will use the
starpu_vector_filter_block() filter function. You can see the list of
predefined filters provided by
StarPU here.
We provide a solution for the
exercice here.
Session Part 2: Optimizations
This is based on StarPU’s documentation optimization chapter.
Data Management
We have explained how StarPU can overlap computation and data transfers
thanks to DMAs. This is however only possible when CUDA has control over the
application buffers. The application should thus use starpu_malloc()
when allocating its buffer, to permit asynchronous DMAs from and to
it.
Take the vector example again, and fix the allocation, to make it use
starpu_malloc().
Task Submission
To let StarPU reorder tasks, submit data transfers in advance, etc., task submission should be asynchronous whenever possible. Ideally, the application should behave like that: submit the whole graph of tasks, and wait for termination.
The CUDA and OpenCL kernel execution themselves should be submitted asynchronously, so as to let kernel computation and data transfer proceed independently:
- In
vector_scal_cuda.cu, one should actually remove thecudaStreamSynchronize(starpu_cuda_get_local_stream());call, and add this flag to the codelet structure, so as to just submit the CUDA kernel, and let StarPU test for its termination:.cuda_flags = {STARPU_CUDA_ASYNC}, - Similarly, in
vector_scal_opencl.c, one should actually remove theclFinish(queue);call, and add this flag to the codelet structure:.opencl_flags = {STARPU_OPENCL_ASYNC},
Performance Model Calibration
Inspection
Performance prediction is essential for proper scheduling decisions, the
performance models thus have to be calibrated. This is done automatically by
StarPU when a codelet is executed for the first time. Once this is done, the
result is saved to a file in $STARPU_PERF_MODEL_DIR for later re-use. The
starpu_perfmodel_display tool can be used to check the resulting
performance model.
STARPU_PERF_MODEL_DIR specifies the main directory in which
StarPU stores its performance model files. The default is
$STARPU_HOME/.starpu/sampling.
STARPU_HOME specifies the main directory in which StarPU
stores its configuration files. The default is $HOME on Unix
environments, and $USERPROFILE on Windows environments.
In this tutorial we provide some pre-calibrated performance models with the Simgrid version of StarPU. You can run
. ./simu.sh
to enable using them, (it sets
STARPU_PERF_MODEL_DIR to a specific
directory perfmodels available in
the archive). Then you can use starpu_perfmodel_display to get the performance
model details:
$ starpu_perfmodel_display -l         # Show the list of codelets that have a performance model
file: <vector_scal.conan>
file: <mult_perf_model.conan>
file: <starpu_dgemm_gemm.conan>
file: <starpu_sgemm_gemm.conan>

$ starpu_perfmodel_display -s vector_scal     # Show the details for one codelet
# performance model for cuda0_impl0 (Comb0)
# performance model for cuda0_impl0 (Comb0)
	Regression : #sample = 132
	Linear: y = alpha size ^ beta
		alpha = 7.040874e-01
		beta = 3.326125e-01
	Non-Linear: y = a size ^b + c
		a = 6.207150e-05
		b = 9.503886e-01
		c = 1.887639e+01
# hash		size		flops		mean (us)	stddev (us)		n
a3d3725e	4096           	0.000000e+00   	1.902150e+01   	1.639952e+00   	10
870a30aa	8192           	0.000000e+00   	1.971540e+01   	1.115123e+00   	10
48e988e9	16384          	0.000000e+00   	1.934910e+01   	8.406537e-01   	10
...
09be3ca9	1048576        	0.000000e+00   	5.483990e+01   	7.629412e-01   	10
...
# performance model for cuda1_impl0 (Comb1)
...
09be3ca9	1048576        	0.000000e+00   	5.389290e+01   	8.083156e-01   	10
...
# performance model for cuda2_impl0 (Comb2)
...
09be3ca9	1048576        	0.000000e+00   	5.431150e+01   	4.599005e-01   	10
...
# performance model for cpu0_impl0 (Comb3)
...
a3d3725e	4096           	0.000000e+00   	5.149621e+00   	7.096558e-02   	66
...
09be3ca9	1048576        	0.000000e+00   	1.218595e+03   	4.823102e+00   	66
...
This shows that for the vector_scal kernel with a 4KB size, the average execution time on CPUs was about 5.1µs, with a 0.07µs standard deviation, over 66 samples, while it took about 19µs on GPU CUDA0, with a 1.6µs standard deviation. With a 1MB size, execution time on CPUs is 1.2ms, while it is only 54µs on GPU CUDA0.
The performance model can also be drawn by using starpu_perfmodel_plot,
which will emit a gnuplot file in the current directory:
$ starpu_perfmodel_plot -s vector_scal
...
[starpu][main] Gnuplot file <starpu_vector_scal.gp> generated
$ gnuplot starpu_vector_scal.gp
$ gv starpu_vector_scal.eps
Unfortunately, gv will most probably not work through docker, but you can transfer the file from outside the docker image with:
docker cp exa2pro-test:/home/exa2pro/starpu_files/starpu_vector_scal.eps .
and open it from outside the docker image.
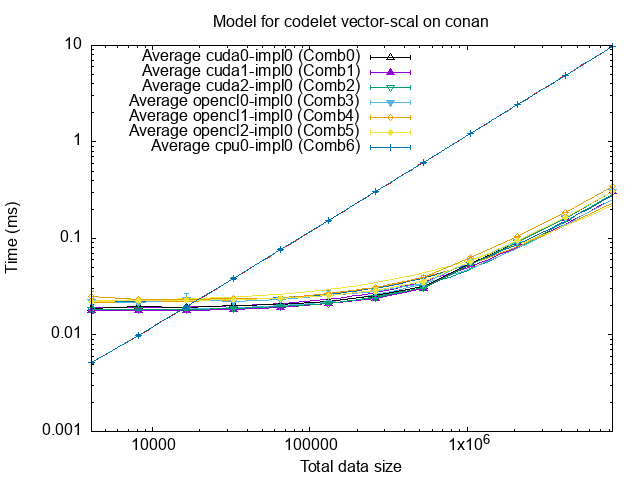
The measurements were made on CPUs, but also GPUs that support both OpenCL and CUDA. The graph shows that GPUs become more efficient for vector size beyond 20000 bytes.
We have also measured the performance of the mult kernel example, which can be
drawn with
starpu_perfmodel_plot -s mult_perf_model
gnuplot starpu_mult_perf_model.gp
gv starpu_mult_perf_model.eps
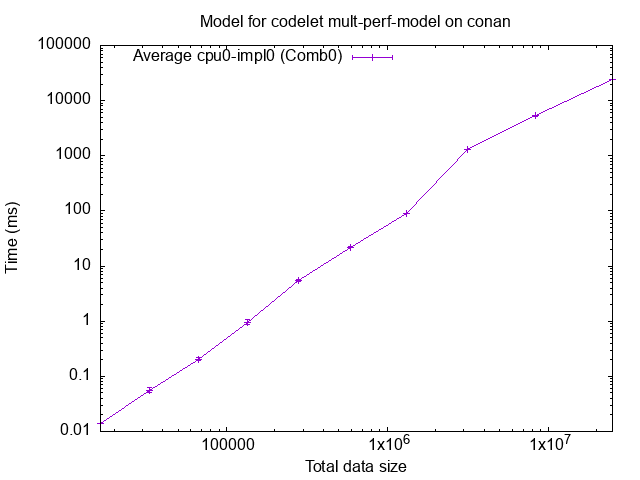 We can see a slight bump after 2MB.
The task submission included the number of flops per task, this allows to draw GFlop/s instead of just time:
starpu_perfmodel_plot -f -s mult_perf_model
gnuplot starpu_gflops_mult_perf_model.gp
gv starpu_gflops_mult_perf_model.eps
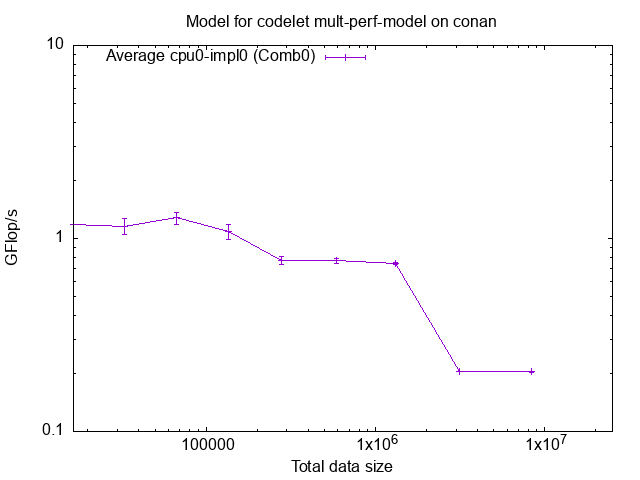 We indeed notice a performance drop after 2MB, which corresponds to the cache size.
(New it StarPU 1.4 to be released) We can also draw the energy used by tasks:
starpu_perfmodel_plot -e -s mult_energy_model
gnuplot starpu_mult_energy_model.gp
gv starpu_mult_energy_model.eps
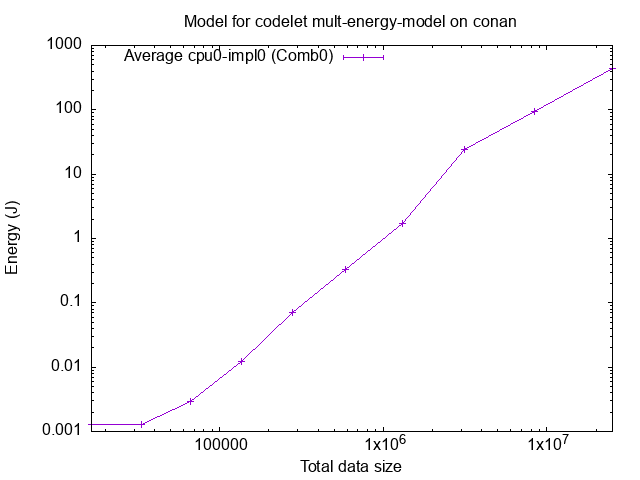 We can again notice the bump after 2MB.
Again, instead of the energy, one can observe the computation efficiency thanks to the flops information:
starpu_perfmodel_plot -f -e -s mult_energy_model
gnuplot starpu_gflops_mult_energy_model.gp
gv starpu_gflops_mult_energy_model.eps
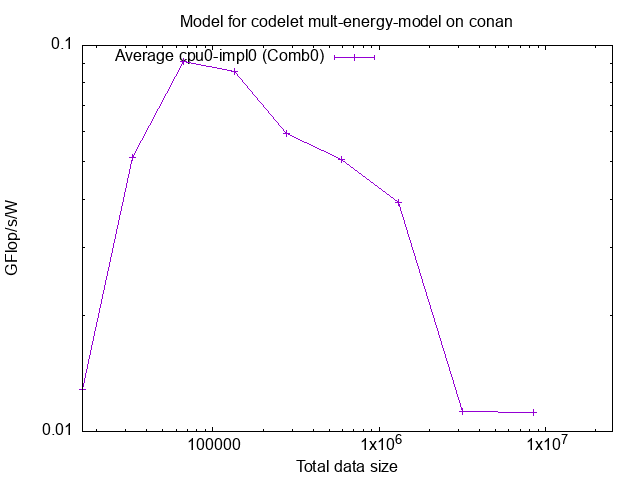 This is much more interesting! We do indeed notice the efficiency drop after
2MB, but we can also notice an efficiency maximum around 100KB.
This is much more interesting! We do indeed notice the efficiency drop after
2MB, but we can also notice an efficiency maximum around 100KB.
Measurement
In order to measure the performance on your actual system, switch back to the non-simgrid version of StarPU:
. ./native.sh
And run the application with
make clean
make mult
STARPU_CALIBRATE=1 ./mult
The performance model can then be seen with
starpu_perfmodel_display -s mult_perf_model
starpu_perfmodel_plot -s mult_perf_model
gnuplot starpu_mult_perf_model.gp
gv starpu_mult_perf_model.eps
It is a good idea to check the variation before doing actual performance
measurements. If the kernel has varying performance, it may be a good idea to
force StarPU to continue calibrating the performance model, by using export
STARPU_CALIBRATE=1
If the code of a computation kernel is modified, the performance changes, the
performance model thus has to be recalibrated from start. To do so, use
export STARPU_CALIBRATE=2
Energy measurement (new in StarPU 1.4 to appear)
CPUs can report their energy usage through performance counters, and NVIDIA devices can report it through the CUDA interface. StarPU provides an interface to abstract the measurement for the application. The available measurement precision is however quite coarse. The principle is thus that the application should submit a series of tasks of the same kind, and put measurement calls before and after the series, so StarPU can compute an average over the whole set.
mult_bench.c achieves this: it prepares matrices so as to generate a fair number of tasks according to the number of cpus so the measurement is long enough.
Unfortunately, with docker the performance counters cannot be read due to administrative permissions. Running the benchmark on the raw system (possibly requering root access) would allow to perform the measurement.
Task Scheduling Policy
By default, StarPU uses the lws simple greedy scheduler. This is
because it provides correct load balance even if the application codelets do not
have performance models: it uses a single central queue, from which workers draw
tasks to work on. This however does not permit to prefetch data, since the
scheduling decision is taken late.
If the application codelets have performance models, the scheduler should be changed to take benefit from that. StarPU will then really take scheduling decision in advance according to performance models, and issue data prefetch requests, to overlap data transfers and computations.
To observe the scheduling between CPUs and GPUs, let us switch back to simulation:
. ./simu.sh
make clean
make
For instance, compare the lws (default) and dmda scheduling
policies:
STARPU_BUS_STATS=1 STARPU_WORKER_STATS=1 STARPU_SCHED=lws gemm/sgemm -xy $((256*4)) -nblocks 4
with:
STARPU_BUS_STATS=1 STARPU_WORKER_STATS=1 STARPU_SCHED=dmda gemm/sgemm -xy $((256*4)) -nblocks 4
You can see most (all?) the computation have been done on GPUs, leading to better performances.
Try other schedulers, use STARPU_SCHED=help to get the
list.
Also try with various sizes (keeping a 256 tile size, i.e. increase both occurrences of 4 above) and draw curves.
You can also try the double version, dgemm, and notice that GPUs get
less great performance.
Sessions Part 3: MPI Support
StarPU provides support for MPI communications. It does so in two ways. Either the application specifies MPI transfers by hand, or it lets StarPU infer them from data dependencies.
We will here have to use the non-simulated version of StarPU, so you have to run
. ./native.sh
make clean
make
Manual MPI transfers
Basically, StarPU provides
equivalents of MPI_* functions, but which operate on DSM handles
instead of void* buffers. The difference is that the source data may be
residing on a GPU where it just got computed. StarPU will automatically handle
copying it back to main memory before submitting it to MPI.
In the mpi/ subdirectory,
ring_async_implicit.c
shows an example of mixing MPI communications and task submission. It
is a classical ring MPI ping-pong, but the token which is being passed
on from neighbour to neighbour is incremented by a starpu task at each
step.
This is written very naturally by simply submitting all MPI communication requests and task submission asynchronously in a sequential-looking loop, and eventually waiting for all the tasks to complete.
cd mpi
make ring_async_implicit
mpirun --allow-run-as-root -np 2 $PWD/ring_async_implicit
starpu_mpi_insert_task
A stencil application shows a basic MPI
task model application. The data distribution over MPI
nodes is decided by the my_distrib function, and can thus be changed
trivially.
It also shows how data can be migrated to a
new distribution.
make stencil5
mpirun --allow-run-as-root -np 2 $PWD/stencil5 -display
Session Part 4: OpenMP Support
The Klang-Omp OpenMP Compiler
The Klang-Omp OpenMP compiler converts C/C++ source codes annotated with OpenMP 4 directives into StarPU enabled codes. Klang-Omp is source-to-source compiler based on the LLVM/CLang compiler framework.
The following shell sequence shows an example of an OpenMP version of the Cholesky decomposition compiled into StarPU code.
cd
source /gpfslocal/pub/training/runtime_june2016/openmp/environment
cp -r /gpfslocal/pub/training/runtime_june2016/openmp/Cholesky .
cd Cholesky
make
./cholesky_omp4.starpu
Homepage of the Klang-Omp OpenMP compiler: Klang-Omp
More Performance Optimizations
The StarPU performance feedback chapter provides more optimization tips for further reading after this tutorial.
FxT Tracing Support
In addition to online profiling, StarPU provides offline profiling tools, based on recording a trace of events during execution, and analyzing it afterwards.
The trace file is stored in /tmp by default. To tell StarPU to store
output traces in the home directory, one can set:
export STARPU_FXT_PREFIX=$HOME/
The application should be run again, for instance:
make clean
make mult
./mult
This time a prof_file_XX_YY
trace file will be generated in your home directory. This can be converted to
several formats by using:
starpu_fxt_tool -i ~/prof_file_*
This will create
- a
paje.tracefile, which can be opened by using the ViTE tool. This shows a Gant diagram of the tasks which executed, and thus the activity and idleness of tasks, as well as dependencies, data transfers, etc. You may have to zoom in to actually focus on the computation part, and not the lengthy CUDA initialization. - a
dag.dotfile, which contains the graph of all the tasks submitted by the application. It can be opened by using Graphviz. - an
activity.datafile, which records the activity of all processing units over time.
Contact
For any questions regarding StarPU, please contact the StarPU developers mailing list starpu-devel@inria.fr